Humana: Patience Will Likely Achieve A Lower Buy Price
by Robert HoneywillSummary
- The only way an investor can realize a return from an investment in shares is through receipt of dividends and gains on share sales. I repeat - the only way.
- The best way to make a gain on sale of shares is to "make your profit when you buy."
- The present Humana share price does not provide an opportunity to "make your profit when you buy."
- Humana share price volatility over the last three months, and the last 12 months, suggests a patient investor will again have opportunities to "make your profit when you buy."
Humana, Inc.: Investment Thesis
As per the description below about the business of Humana (HUM) the company is a well-established operator in the healthcare sector. Also as described below, the company is obviously highly innovative in growing the business and is actively utilizing technology to manage healthcare and improve levels of care. So, I would regard the business of the company as highly suitable for investment. But, as is often the case with a public company and its shares, there's currently a dichotomy between the underlying intrinsic value of the business and the market value of Humana's shares. In this case, based on analysts' EPS growth estimates, buying shares at the current share price of $342.09 is likely to only provide returns in the high single digits over the next four years. I believe those levels of return are on the low side for the risks involved. The company has seen the share price plummet on occasions over the last 12 months due to fears of politically-inspired changes to Medicare. The shares have had a run up recently, and with a little patience there's a good likelihood Humana shares will be available at lower entry share price over the next few months.
Please read on to learn more about the company and some of the initiatives it's currently undertaking. Following on from that, I set out the methods and calculations used to quantify indicative future rates of return for Humana.
About Humana

Source: Humana Inc. website
From the Humana Q3-19 10-Q filing,
General Humana Inc.... a leading health and well-being company committed to helping our millions of medical and specialty members achieve their best health. …Our range of clinical capabilities, resources and tools, such as in home care, behavioral health, pharmacy services, data analytics and wellness solutions, combine to produce a simplified experience... Business Segments We manage our business with three reportable segments: Retail, Group and Specialty, and Healthcare Services. … The reportable segments are based on a combination of the type of health plan customer and adjacent businesses centered on well-being solutions for our health plans and other customers, as described below.... The Retail segment consists of Medicare benefits, marketed to individuals or directly via group Medicare accounts. In addition, the Retail segment also includes our contract with CMS to administer the Limited Income Newly Eligible Transition, or LI-NET, prescription drug plan program and contracts with various states to provide Medicaid, dual eligible, and Long-Term Support Services benefits, ... The Group and Specialty segment consists of employer group commercial fully-insured medical and specialty health insurance benefits marketed to individuals and employer groups, including dental, vision, and other supplemental health benefits, as well as administrative services only, ... our Group and Specialty segment includes our military services business, primarily our TRICARE T2017 East Region contract. The Healthcare Services segment includes our services offered to our health plan members as well as to third parties, including pharmacy solutions, provider services, and clinical care service, such as home health and other services and capabilities ... We reported under the category of Other Businesses those businesses that did not align with the reportable segments described above, primarily our closed-block long-term care insurance policies, which were sold in 2018. Assets and certain corporate income and expenses are not allocated to the segments, including the portion of investment income not supporting segment operations, interest expense on corporate debt, and certain other corporate expenses. ….
Important Humana Technology Initiatives
Excerpts from the Humana Q3 earnings call, describing how technology is aiding in ensuring patients get and take correct medication, and ensuring health checks relevant to their medical condition. All this aided by Microsoft (NASDAQ:MSFT) and IBM (NYSE:IBM) support including Watson.
...Recently Humana Pharmacy developed what we believe is the first clinical decision support fire integration in production between a payer and a provider via their clinical workflow. Our partner Signifyd Health is now using our OneMedList in connection with an in-home assessments, giving them the ability to confirm in real time member adherence to their medication and more proactively identify potential adverse drug interventions and drug disease conflicts. During 2020 we will roll this same functionality to all Kindred at Home and other health care – health home health providers ...The integration of technology like OneMedList with Kindred at Home is enabled by Humana's integration with the home care, home-based electronic medical record and practice management system.... just a few weeks ago, we announced a strategic partnership with Microsoft, focused on building modern healthcare solutions for Humana members aimed at improving their health outcomes and making their healthcare experiences simpler to navigate. The main objectives of this partnership center on evolving our organization to cloud to improve our speed and efficiency, while assisting us in key initiatives such as the build out of our longitudinal record so that our members and their care teams have a complete view of their health records for real time interventions.... our partnerships with Microsoft will help amplify our home health strategy through the use of their home devices, natural language processing and device data integration. Similarly, we continue to work closely with key partners like IBM, helping enable data interoperability across our ecosystem and voice-based self-service capabilities using Watson to better serve our providers. ... January, 2020 we are launching a new population health management platform, population insights compass, that makes it easy for primary care providers to manage the complexity of value-based payment models. These tools meet a critical need of our providers and that it delivers a single solution for all payers. .... Providers who will have access to multiple sources of data in one location including medical and pharmacy claims, financial data, serious opportunities, clinical programs and predictive models....When it comes to leveraging the power of value-based care, Humana has continued to make progress for our MA members. For example, when comparing members in Humana MA value-based agreements to those and Humana MA for fee-for-service arrangements, we've seen 9% more eye exams for individuals with diabetes and 21% increase in blood sugar control management.
Humana: Assessing Historical And Potential Future Shareholder Returns
In this article, I hope to show how targeting a desired return on an investment in shares can be facilitated by actually estimating what future returns will be based primarily on analysts' EPS estimates and other publicly available data.
First, I provide details of actual rates of return for Humana shareholders investing in the company over the last four to five years.
Table 1 - Humana: Historical Shareholder Returns
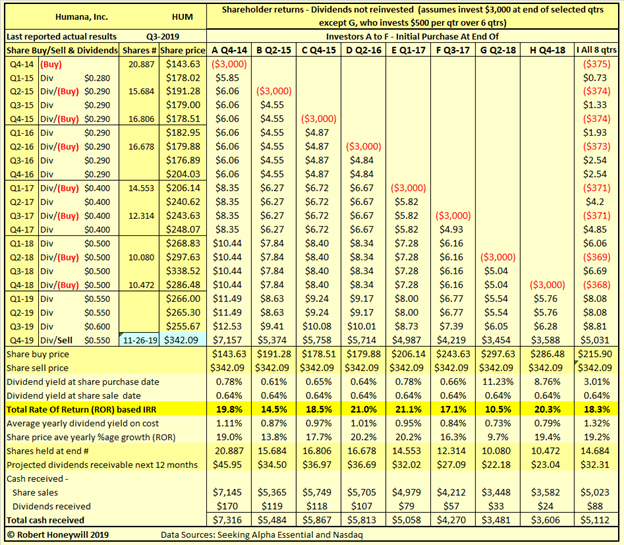
For many stocks, where I create a table similar to Table 1 above, I find a wide range of returns indicating a degree of volatility and risk. Table 1 above shows the results for Humana were positive for all of nine different investors, each investing $3,000 over the last five years, and holding to the present. The average yearly rates of return range from 10.5% for investor G to 21% for investor D. These rates of return are not just hypothetical results, they are very real results for anyone who purchased shares on the various dates and held through to Nov. 26, 2019. In considering which investor in Table 1 has achieved the best investment returns, we must take into account not only the percentage rate of return but also the "duration" of the investment. Investor D has the highest rate of return at 21%, and the investment has grown in absolute terms by $2,813 from $3,000 to $5,813. If investor D continues to hold, but the Humana share price remains around current levels, the percentage rate of return will decrease the longer the shares are held due to the effect of duration. Investor A's average yearly rate of return at 19.8% is less than that of investor D. But, due to duration, investor A's investment has grown by $4,316, $1,503 more than investor D's investment. Of course, investor A has had their funds tied up since Q4 2014. Investor D has likely had their funds invested elsewhere between Q4 2014 and Q2 2016. But those funds would have required percentage rates of return up around 19% to match investor A's investment performance. Long duration and high rates of return are very powerful allies for investors.
Humana: Projecting Future Shareholder Returns
If rate of return is the basis on which we judge the performance of our investments, then surely we should be seeking to estimate future likely rates of return when we are making investments. But how do we do that? I use proprietary models to generate net income, balance sheet/cash flow, and projected rates of return going out five years. Much of this is automated but still involves a great deal of research and business and data analysis to back up the projections. Let us first look at the traditional approach to assessing value of a stock for investment purposes.
Humana: Qualitative Assessment Of Value Grade For Share Investment Decisions
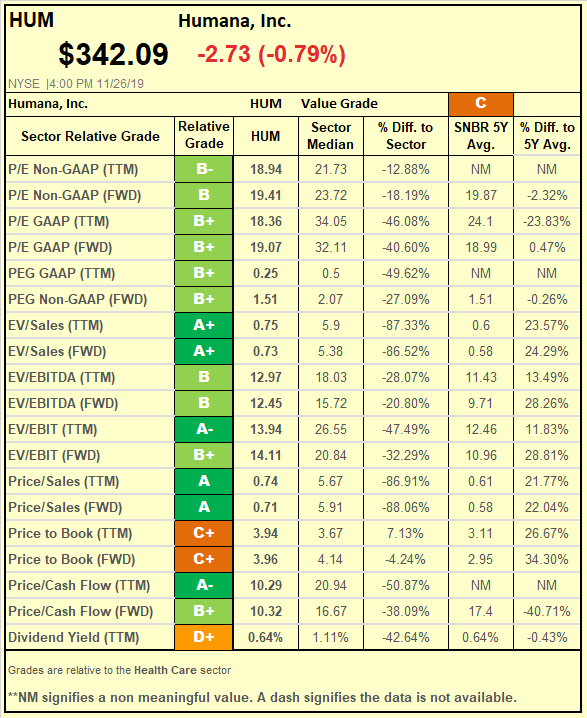
Figure 1 below is based on data from Seeking Alpha Premium.
Figure 1
Data Source: Seeking Alpha Premium Valuation Metrics
As can be seen, Figure 1 is a qualitative assessment of Humana providing an overall value grade of "C" for share investment at current share price. Seeking Alpha Premium also provides analysts' estimates of EPS for Humana as per Figure 2 below.
Figure 2 - Summary Of Analysts' Adjusted Non-GAAP EPS Estimates
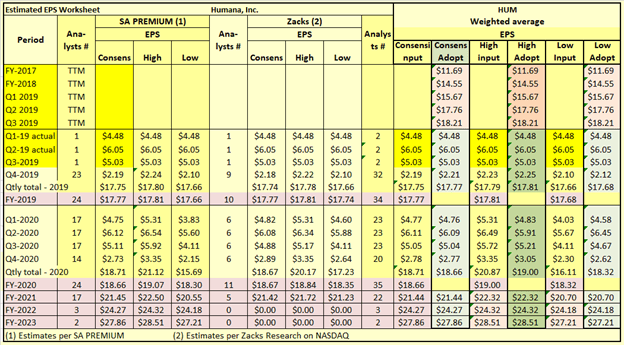
I incorporate analysts' EPS estimates from both SA Premium and from Zacks Research into the averages I adopt for EPS estimates.
As for the value grading per Figure 1, EPS and EPS growth estimates are qualitative in nature and do not quantify the rate of return that can be expected for the stock in question.
Figure 3 - Non-GAAP P/E Ratios, Historical And Future Estimates
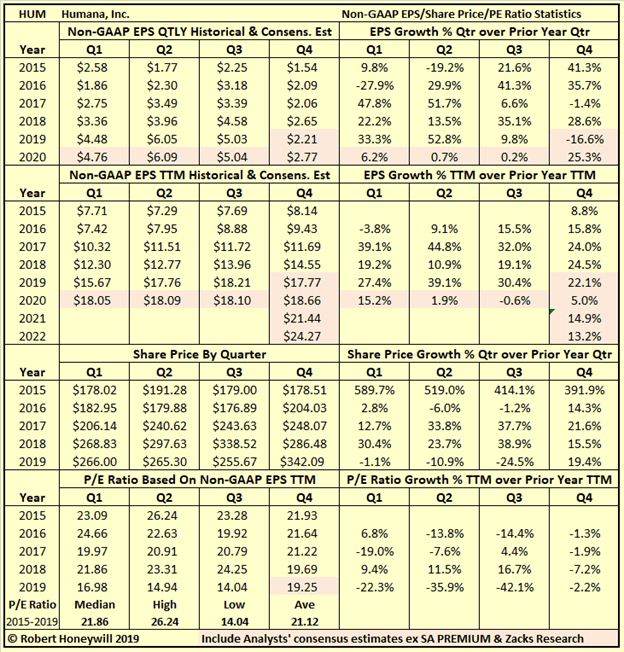
Figure 3 is primarily designed to determine an appropriate range of non-GAAP P/E ratios for determining estimated future share price levels for Humana. This is necessary for quantifying estimated future rates of return. Figure 3 also informs us of past non-GAAP EPS growth rates compared to forward estimates of EPS growth based on analysts' consensus estimates. The forward EPS estimates indicate growth of 22.1% for 2019 over 2018. Based on analysts' consensus estimates, growth in EPS in 2020 is estimated to be lower at 5.0%, followed by growth in 2021 and 2022 of 14.9% and 13.2%, respectively. It should be understood, in quantifying the short form estimated rates of return below, I'm relying purely on the soundness of analysts' consensus estimates of EPS.
Humana: Quantitative Assessment Of Value For Investment
Before developing my own detailed estimates of future earnings, cash flows, etc., for a given company, I can quantify the range of potential rates of return utilizing analysts' estimates of EPS available from Seeking Alpha Premium, Zacks Research through Nasdaq, and other qualitative data per Figures 1, 2 and 3 above. Table 2 below shows my 1View∞Scenarios Dashboard developed for this purpose, and in this case, I use the dashboard to quantify potential rates of return from an investment in Humana at current share price.
Table 2 - 1View∞Scenarios Dashboard Humana Projected Rates Of Return
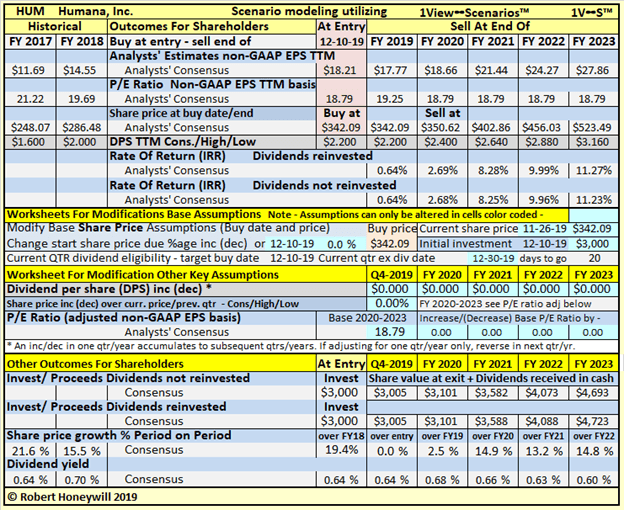
Table 2 shows buying at the current share price would result in rates of return of ~8% to 11% for exits at end of years FY 2021 to FY 2023. These rates of return assume EPS results in accordance with analysts' consensus estimates per Fig. 2 above and a constant P/E ratio of 18.79. The P/E of 18.79 is based on Humana's current P/E of 18.79 (current share price $342.09 divided by Q3 2019 TTM EPS of $18.21 per Fig. 2 above).
The Dashboard will hopefully seem less daunting, if I walk you through it from top to bottom.
- Analyst Estimates non-GAAP EPS TTM - The EPS amounts come straight from Figure 2 above.
- P/E Ratio Non-GAAP EPS TTM basis - Through end of FY 2019, the P/E ratios are calculated by dividing actual/projected share price by actual/projected EPS. For FY2020 to FY2023, the P/E ratio is input through the assumptions section further down in Table 2.
- Share price at buy date/end date - The buy date share price is the share price at which you are targeting to buy the shares. It's either the current share price or the lower entry share price you are targeting per the assumptions further down in Table 2. The end share price is the calculated share price at the end of the period you are planning to hold your investment.
- Dividend increases included in the base projections are my estimates of a ~9% to 10% per share quarterly dividend increase occurring in the first quarter of each year, in line with the FY 2019 Q1 increase.
- Rate of Return ("IRR") - This is the projected rate of return you will achieve based on the assumptions that have been input. The rates of return calculated here are calculated on the same basis as the actual rates of return per Table 1 above.
- Current share price - This is a direct input that can be changed from day to day as the share price changes.
- Change start share price - This allows changes to the starting buy share price if the current share price does not indicate a satisfactory rate of return for your requirements. Particularly with a ticker showing a degree of volatility, there can be opportunities to buy at a lower share price than the current share price. This function allows to determine in advance at what share price you would find the indicative rate of return attractive (see also worked example further below).
- Current QTR dividend eligibility - By putting in both the targeted buy date and the ex-dividend date (for dividend paying stocks), the current quarter's dividend will be included or excluded from return calculations. Note, in the current quarter, Humana's stock goes ex-dividend on Dec. 30, 2019.
- Share price over current price/previous quarter - This allows to project a higher or lower share price at end of or during Q4-19 by adjusting share prices by a percentage up or down. In Table 2 above, I have input assumptions that share price will change by nil% by end of Q4 - adjusted non-GAAP EPS TTM is estimated to decrease slightly in Q4.
- P/E ratio (adjusted non-GAAP EPS basis) - Rather than modeling share price changes by a percentage increase or decrease, share prices for FY 2020 to 2023 are projected on the basis of multiplying assumed P/E Ratio by Analysts' EPS estimates for each year. The Base P/E Ratio assumption for FY 2020 to FY2023 is based on Humana's current P/E ratio.
- Other outcomes for shareholders show the proceeds projected to be received from the investment, and projected share price growth rates and dividend yields flowing from the input assumptions.
Humana: Targeting A Satisfactory (To You) Return On Investment
The problem with waiting until shares are cheap to buy is they may have become cheap because the outlook for the stock and its earnings has worsened. But there can be a considerable volatility in the price of shares with no discernible change in outlook, as shown in Figures 3.1 and 3.2 below.
Figure 3.1 Humana Versus S&P 500 Index - 1 Year To Date
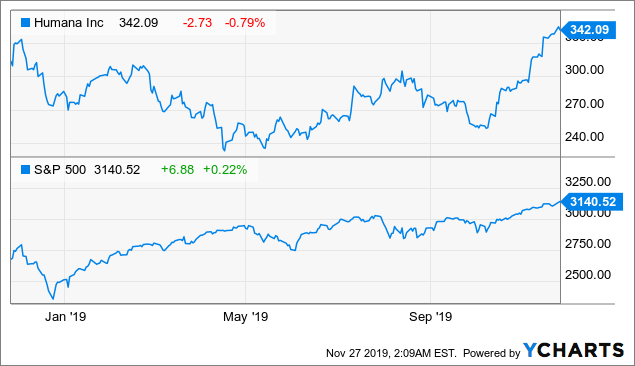
Humana's shares are currently trading ~10% above the share price one year ago. In contrast, the S&P 500 is trading today ~17% above a year ago. Humana's share price has also shown far more volatility than the S&P 500 over the last year.
Figure 3.2 Humana Vs. S&P 500 Index - August 1, 2019 To Date
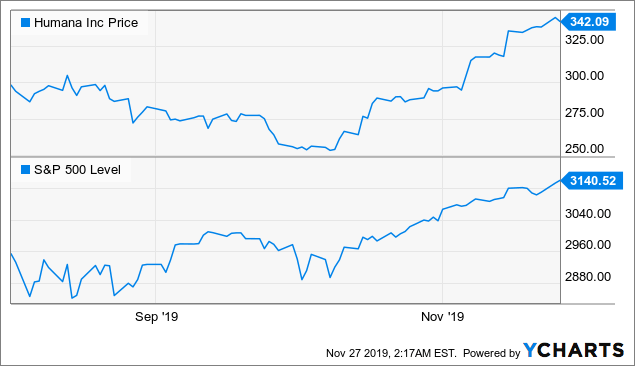
Figure 3.2 shows the S&P 500 has increased by ~6% from ~2,950 at beginning of August to its current 3,140 level. Over the same period, Humana's share price has increased by ~14% from ~$300 to the current level ~$342, but not before sinking down close to the $250 level.
Using the 1View∞Scenarios Dashboard, I'm able to see the effect on projected rates of return of targeting to buy Humana shares ~$300.00 in Q4-2019.
Timing Stocks Versus Timing The Market
TABLE 3 1View∞Scenarios Dashboard Humana Projected Rates Of Return
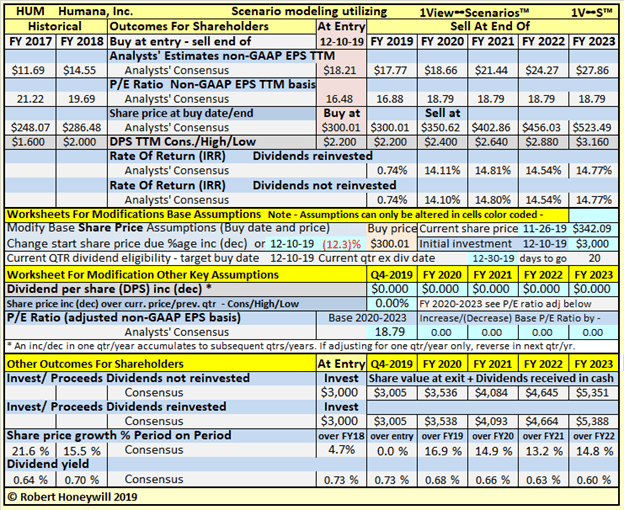
In Table 2, buying at the current share price of ~$342 would give indicative average yearly rates of return of ~8% to 11% for years FY 2021 to FY 2023. Table 3 shows by buying at ~$300 the indicative average yearly rates of return increase to much healthier ~14% to 15% for years FY 2021 to FY 2023. The impact of buying at a lower price improves returns in most years by greater than the dividend yield. And of course, if using DRIP, the lower the share price, the greater number of dividend paying shares, and thus dividends, for a similar amount invested. In the case of Humana, waiting for a possible lower share price is possibly a quite reasonable option given the volatility in the share price over the last 12 months.
Targeting to buy stocks at a favorable entry price is quite different and should not be confused with timing the market. Timing the market requires you to increase or decrease the total value of your portfolio of stocks depending on the direction you perceive the market is heading. Regardless where the market is heading, individual share prices fluctuate independent of market movement.

Whether building or re-weighting a portfolio, targeting favorable prices for share additions does not require periods of not buying at all. With 1View∞Scenarios Dashboards set up for each of the stocks in your portfolio, it's possible to select for additional purchases those stocks in your portfolio that presently have the most favorable indicative future return at current or targeted share prices.
Humana: Stress Testing With The 1View∞Scenarios Dashboard
Table 4 - Assume Long-term Adjusted Non-GAAP P/E Ratio of 15.0
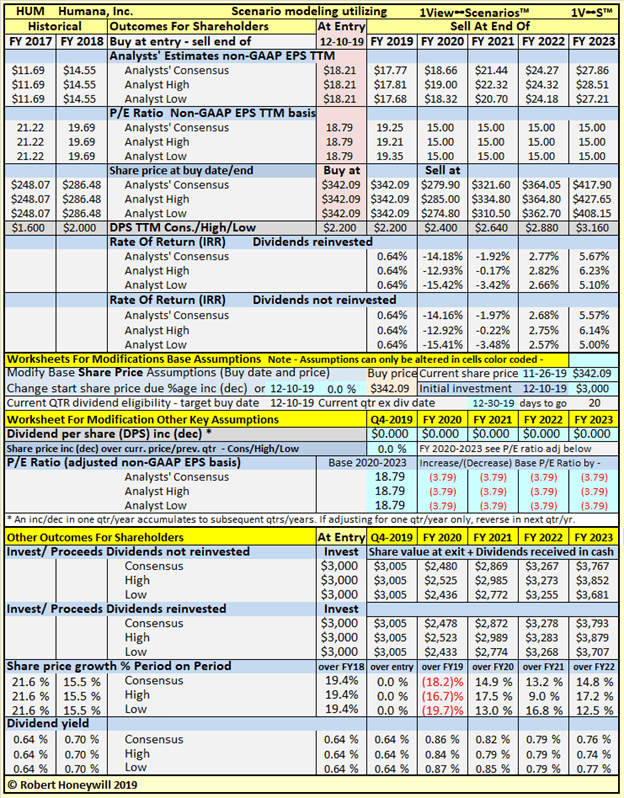
Figure 3 above shows the low P/E for Humana over the last five years is 14.04. Table 4 shows what would happen to projected rates of return if P/E multiples for Humana dropped to 15.0 (~20% below present P/E of 18.79) for FY2020 to FY2023. The 1View∞Scenarios Dashboard shows the projected returns based on analysts' estimates are negative for FY 2020 and FY 2021 for consensus, high and low estimates. For FY 2022 and FY 2023 estimated returns are respectively ~3% and ~6% for consensus, high and low cases. The lack of any material difference between high and low cases for FY 2022 and 2023 is primarily due to submissions by only 2 to 3 analysts with similar estimates per Fig. 2 above.
The foregoing assumes current analysts' consensus estimates continue to be met, and dividends per share continue to grow at similar levels to the past.
Humana: Limitations Of This Short Form Analysis
The short form analysis carried out above relies heavily on analysts' estimates of future adjusted non-GAAP EPS for Humana going out four to five years. Having said that, there are a considerable number of analysts (see Fig. 2 above) providing estimates for Humana, so the consensus estimates are broadly based. The number of analysts covering the stock reduces in the outer years so reliability of estimates will reduce for those years. For small-cap stocks of interest but with limited analyst coverage, I find it useful to produce my own detailed estimates. This can reveal opportunities not necessarily captured in analyst consensus estimates. I do not expect that's likely in the case of reasonably well-covered stocks such as Humana. I do however draw attention to the fact Humana had some of its business in Long Term Care Insurance which has caused concern for GE, even after the sale of the LTC business.
Humana: Conclusions
The best time to buy a stock is when you can make a profit when you buy. Based on the various projections above Humana appears to be fully valued at present. Based on share movements over the last 12 months, and ongoing concerns in relation to possible Medicare changes, it's likely Humana shares will again trade at the ~$300 level or lower in the months ahead. Using the 1View∞Scenarios Dashboard it's possible to estimate in advance the share buy price level that would likely provide a rate of return satisfactory to you. The Humana share price might not reach that level, but do this across sufficient stocks and the likelihood of buying shares that meet your return criteria will be greatly increased. Note for the current quarter the stock goes ex-dividend Dec. 30, 2019.
If you wish to be notified of future articles, please click "Follow" next to my name at the top of this article.
Or become an Analysts' Corner member and share investing ideas with a like-minded group:
- Bleisure travel has the airline industry on a growth path – join in discussing our in-depth reviews of 6 significant airlines.
- Access 1View∞Scenarios™ dashboards to allow scenario testing for tickers of interest.
- You are welcome to register today with Analysts' Corner to take advantage of market sentiment and company fundamentals, to objectively target rates of return, rather than make purely qualitative assessments based on imperfect and inappropriate data.
Disclosure: I/we have no positions in any stocks mentioned, and no plans to initiate any positions within the next 72 hours. I wrote this article myself, and it expresses my own opinions. I am not receiving compensation for it (other than from Seeking Alpha). I have no business relationship with any company whose stock is mentioned in this article.
Additional disclosure: Disclaimer: The opinions in this document are for informational and educational purposes only and should not be construed as a recommendation to buy or sell the stocks mentioned or to solicit transactions or clients. Past performance of the companies discussed may not continue and the companies may not achieve the earnings growth as predicted. The information in this document is believed to be accurate, but under no circumstances should a person act upon the information contained within. I do not recommend that anyone act upon any investment information without first consulting an investment advisor and/or a tax advisor as to the suitability of such investments for their specific situation. Neither information nor any opinion expressed in this article constitutes a solicitation, an offer, or a recommendation to buy, sell, or dispose of any investment, or to provide any investment advice or service. An opinion in this article can change at any time without notice.