Cotton - The Fluffy Fiber Continues To Work Its Way Higher
by Andrew HechtSummary
- A recovery to 96.50 cents ran out of steam in June 2018.
- Cotton falls to just over the 2016 bottom.
- A bullish pattern since late August.
- Levels to watch in the cotton market.
- BAL is the cotton ETN product that tracks the futures.
In late 2008, the price of cotton futures fell to the lowest price since 2002 when they found a bottom at 36.70 cents per pound. Before 2010, the all-time peak in the cotton market was at $1.1720 in 1995. In 2010, the cotton futures market on the Intercontinental Exchange below through the record high like a hot knife goes through butter. The price continued to rise and made its way to $2.27 per pound in March 2011. The cotton market moved to a level where Asian garment manufacturers began using synthetic fibers.
As demand dried up, gravity hit the cotton futures market. After trading at almost twice the previous record level, cotton futures fell below $1 per pound just four months late in July 2011. Cotton eventually worked its way back down to a low at 55.66 cents per pound in March 2016. The massive rally in cotton that caused the substitution by synthetic fibers caused inventories in the US and China to rise to a level where there was enough cotton to manufacture two pairs of jeans for each man, woman, and child on the planet.
After falling to the 2016 low, the inventories in the cotton market began to decline finally. The most direct route for a long or short position in the cotton market is via the futures that trade on the Intercontinental Exchange. The iPath Series B Bloomberg Cotton Subindex Total Return ETN product (BAL) tracks the price action in the cotton futures market.
A recovery to 96.50 cents ran out of steam in June 2018
After trading to a low at 55.66 cents per pound in March 2016, which was over 75% below the 2011 peak price, the bottom in cotton gave way to a slow and steady rally.
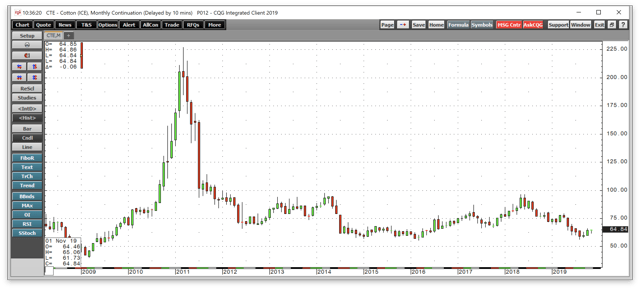
The monthly chart shows, the massive supplies created by the rally to over $2 per pound weighed on the price of ICE cotton futures and took the price to a low at 55.66 cents in March 2016, where the market ran out of selling. Cotton futures then made higher lows and higher highs over the following two years, reaching a peak at 96.50 cents in June 2018. The first level of technical resistance below $1 as cotton was moving higher in mid-2018 was at the March 2014 peak at 97.35 cents. However, cotton ran out of upside steam, and the price fell back towards the 2016 low throughout the second half of 2018 and until August 2019.
Cotton falls to just over the 2016 bottom
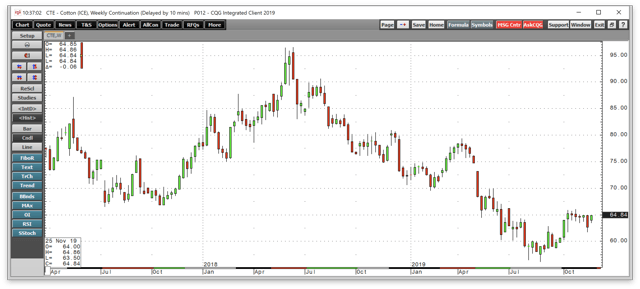
The cotton futures market had a rough time from June 2018 through August 2019. Since the US and China are both significant producers of the fiber, and the Chinese are one of the leading consumers, the escalating trade war put cotton in the crosshairs of protectionist measures and retaliation.
Source: CQG
The weekly chart illustrates the decline from 96.50 cents in mid-2018 to a low at 56.19 cents during the week of August 28, 2019. The drop of 41.8% came on the back of trade issues that took cotton to a level that was only 0.53 cents above the March 2016 bottom when the futures ran out of steam on the downside.
A bullish pattern since late August
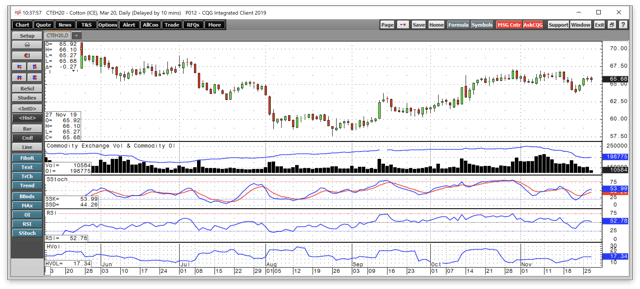
The higher low combined with rising hopes for a "phase one" trade deal between the US and China caused the recent recovery in the cotton futures market. While the nearby ICE cotton futures contract fell to a low at 56.19 cents, the now active month March futures contract declined to 57.65 cents.
Source: CQG
The daily chart displays the recovery in the cotton market that began in late August. The fiber futures have made higher lows and higher highs over the past three months. Price momentum and relative strength indicators are leaning higher at just above neutral readings. Daily historical volatility at 17.634% is around a midpoint level. The total number of open long and short positions in the ICE futures market has dropped from 249,817 contracts on November 4 to 198,775 contracts as of November 27. The open interest metric had been rising with the price since late August, which was a validation of the bullish price trend. However, the recent decline over this month is likely a function of the roll from December to March futures on the Intercontinental Exchange.
Levels to watch in the cotton market
The most recent high in the March futures contract is at the October 30 peak at 67.13 cents, which stands as the first level of technical resistance. Above there, 70 cents is the next level to watch. On the downside, technical support is at the November 21 low of 63.70 cents per pound on the March futures contract.
Source: CQG
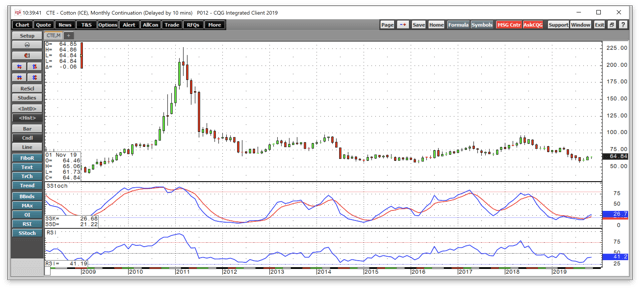
The monthly chart highlights the longer-term technical picture for the cotton market. The trade war will continue to be the most significant factor when it comes to the path of least resistance of the price of the fiber. On the upside, a move above technical resistance at 79.31 cents could trigger a herd of buying. The August low at 56.19 is the line in the sand on the downside. At the 64.66 cents level on the expiring December futures contract, cotton is a bit below the midpoint of its trading range. There is plenty of room for cotton to move around and respond to the ups and downs of the trade war without violating technical support or resistance levels over the coming weeks and months.
Meanwhile, the monthly chart shows that the price momentum has crossed higher in oversold territory, which is a bullish sign for the price of the fiber. Relative strength at just under the 41 level is below a neutral reading but above an oversold condition. The technical metrics point to higher odds for a continuation of the price recovery as opposed to another test of the downside over the coming months.
Cotton ends to reach peaks in March through June. In 2011, the $2.27 high came in March. The price peaked at 97.35 cents in March 2014, and the high at 87.18 cents came in May 2017. In 2018, the most recent significant peak at 96.50 came in June. Any price weakness over the coming weeks and months could be a buying opportunity if cotton will repeat its seasonal trading pattern in 2020.
BAL is the cotton ETN product that tracks the futures
The most direct route for a risk position in the volatile cotton market is via the futures and futures options that trade on the Intercontinental Exchange. Market participants who do not venture into the leveraged world of the futures arena can use the iPath Series B Bloomberg Cotton Subindex Total Return ETN product to establish a position in the cotton market. The ETN does a reasonable job tracking the price of cotton futures. The fund summary for BAL states:
The investment seeks return linked to the performance of the Bloomberg Cotton Subindex Total Return. The ETN offers exposure to futures contracts and not direct exposure to the physical commodities. The index is composed of one or more futures contracts on the relevant commodity (the index components) and is intended to reflect the returns that are potentially available through (1) an unleveraged investment in those contracts plus (2) the rate of interest that could be earned on cash collateral invested in specified Treasury Bills. Source: Yahoo Finance
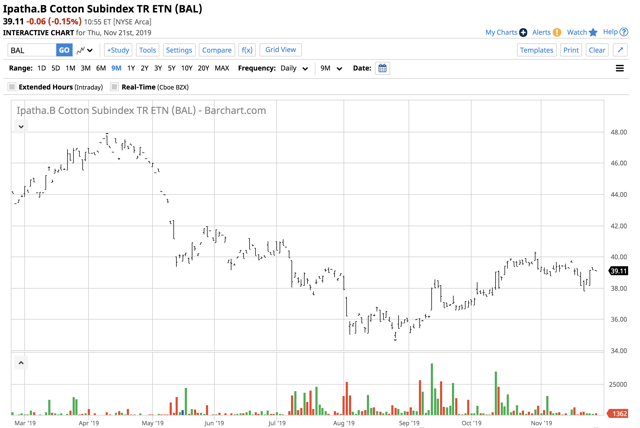
BAL has net assets of $10.51 million and trades an average of 6,916 shares each day. The ETN charges an expense ratio of 0.45%. The price of March cotton futures on ICE rose from 57.65 on August 26 to a high at 67.13 on October 30, a rise of 16.44%.
Source: Barchart
Over the same period, BAL moved from $34.80 to $40.32 per share or 15.86% as the ETN did an excellent job replicating the price action in the cotton futures market since late August.
Since the price of cotton tends to reach seasonal peaks in March through June during bullish years, now could be the perfect time to consider adding the fluffy fiber to your portfolio. Trade between the US and China will continue to be the most significant factor when it comes to the path of least resistance of the price of the soft commodity.
The Hecht Commodity Report is one of the most comprehensive commodities reports available today from the #2 ranked author in both commodities and precious metals. My weekly report covers the market movements of 20 different commodities and provides bullish, bearish and neutral calls; directional trading recommendations, and actionable ideas for traders. I just reworked the report to make it very actionable!
Disclosure: I/we have no positions in any stocks mentioned, and no plans to initiate any positions within the next 72 hours. I wrote this article myself, and it expresses my own opinions. I am not receiving compensation for it (other than from Seeking Alpha). I have no business relationship with any company whose stock is mentioned in this article.
Additional disclosure: The author always has positions in commodities markets in futures, options, ETF/ETN products, and commodity equities. These long and short positions tend to change on an intraday basis.